Start to… People Analytics
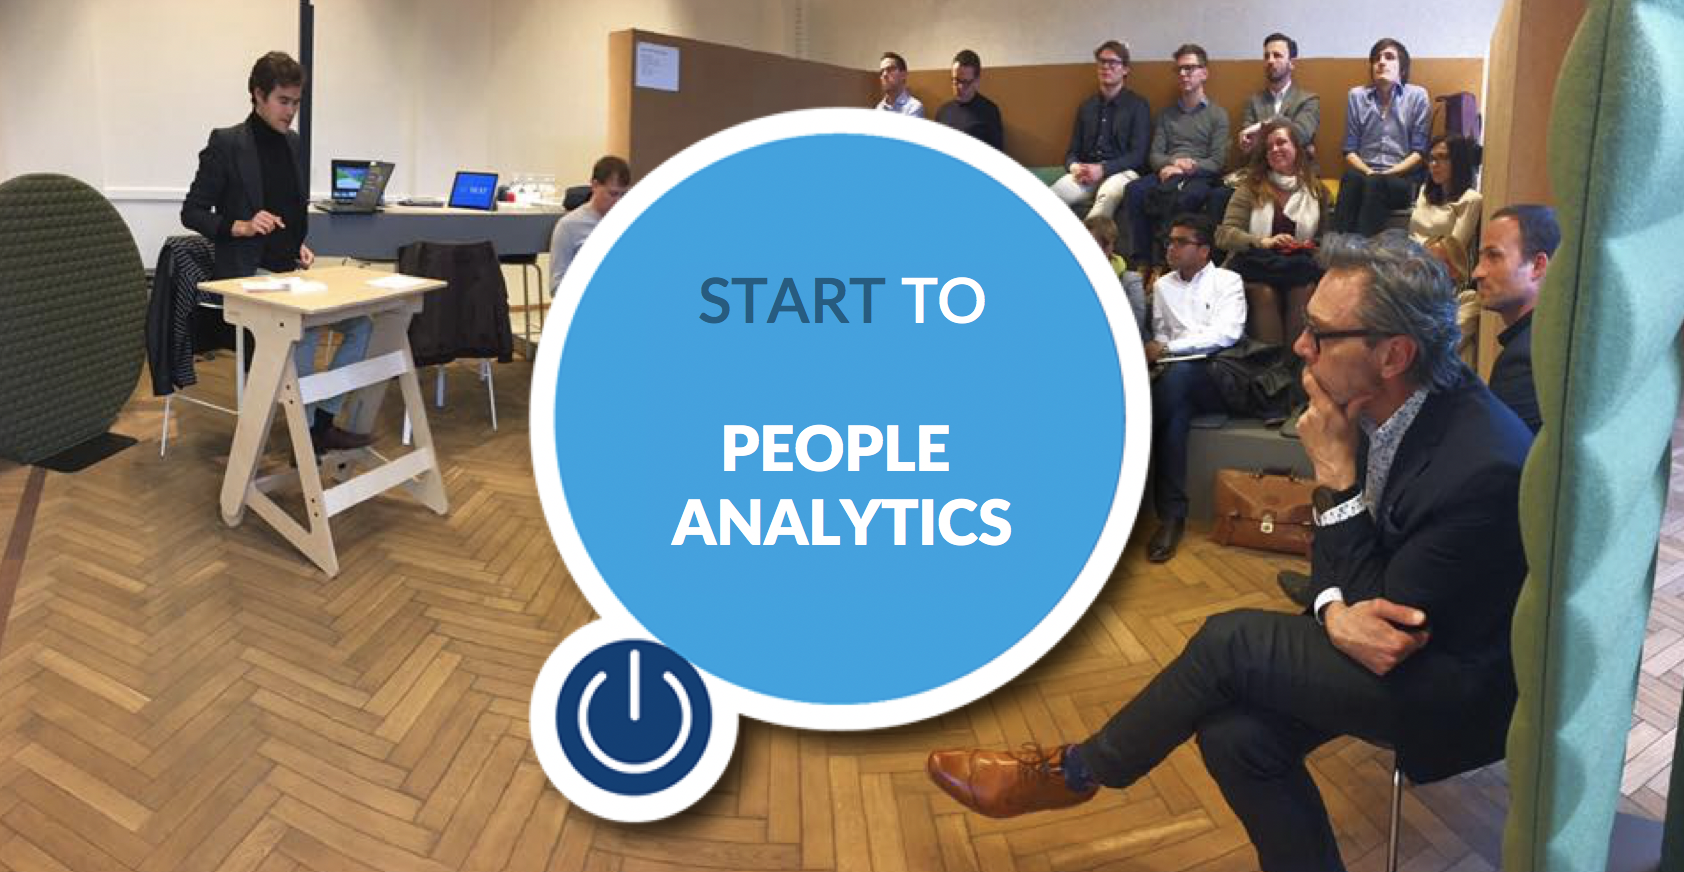
Yesterday we had our first People Analytics Belgium event, with central theme “How to start with People Analytics”. I gave a short intro on this new community, on using Advanced Analytics in HR, and how this fits into the roles of HR.
As specific use cases tell much more than long introductions (thx Andy Vanzurpele and Bruce Fecheyr-Lippens to sharing the people analytics journeys of respectively ING & Solvay!), I kept my intro to a minimum. People asked me to share my two slides, so why not sharing in a post for those who couldn’t attend our kick-off event. Here we go…
People Analytics is about measuring the business impact of HR initiatives. That’s clearly something different than ensuring all salaries get paid correctly by the end of the month.
1. Hitting the Wall in HR
I started yesterday with a visualization generally known as “Hitting the Wall in HR”, by John Boudreau and others. Google to find Boudreau’s initial version (2010) of this image as it was before the HR Tech waves on talent cloud management systems & Next Gen HR Tech/Digital.
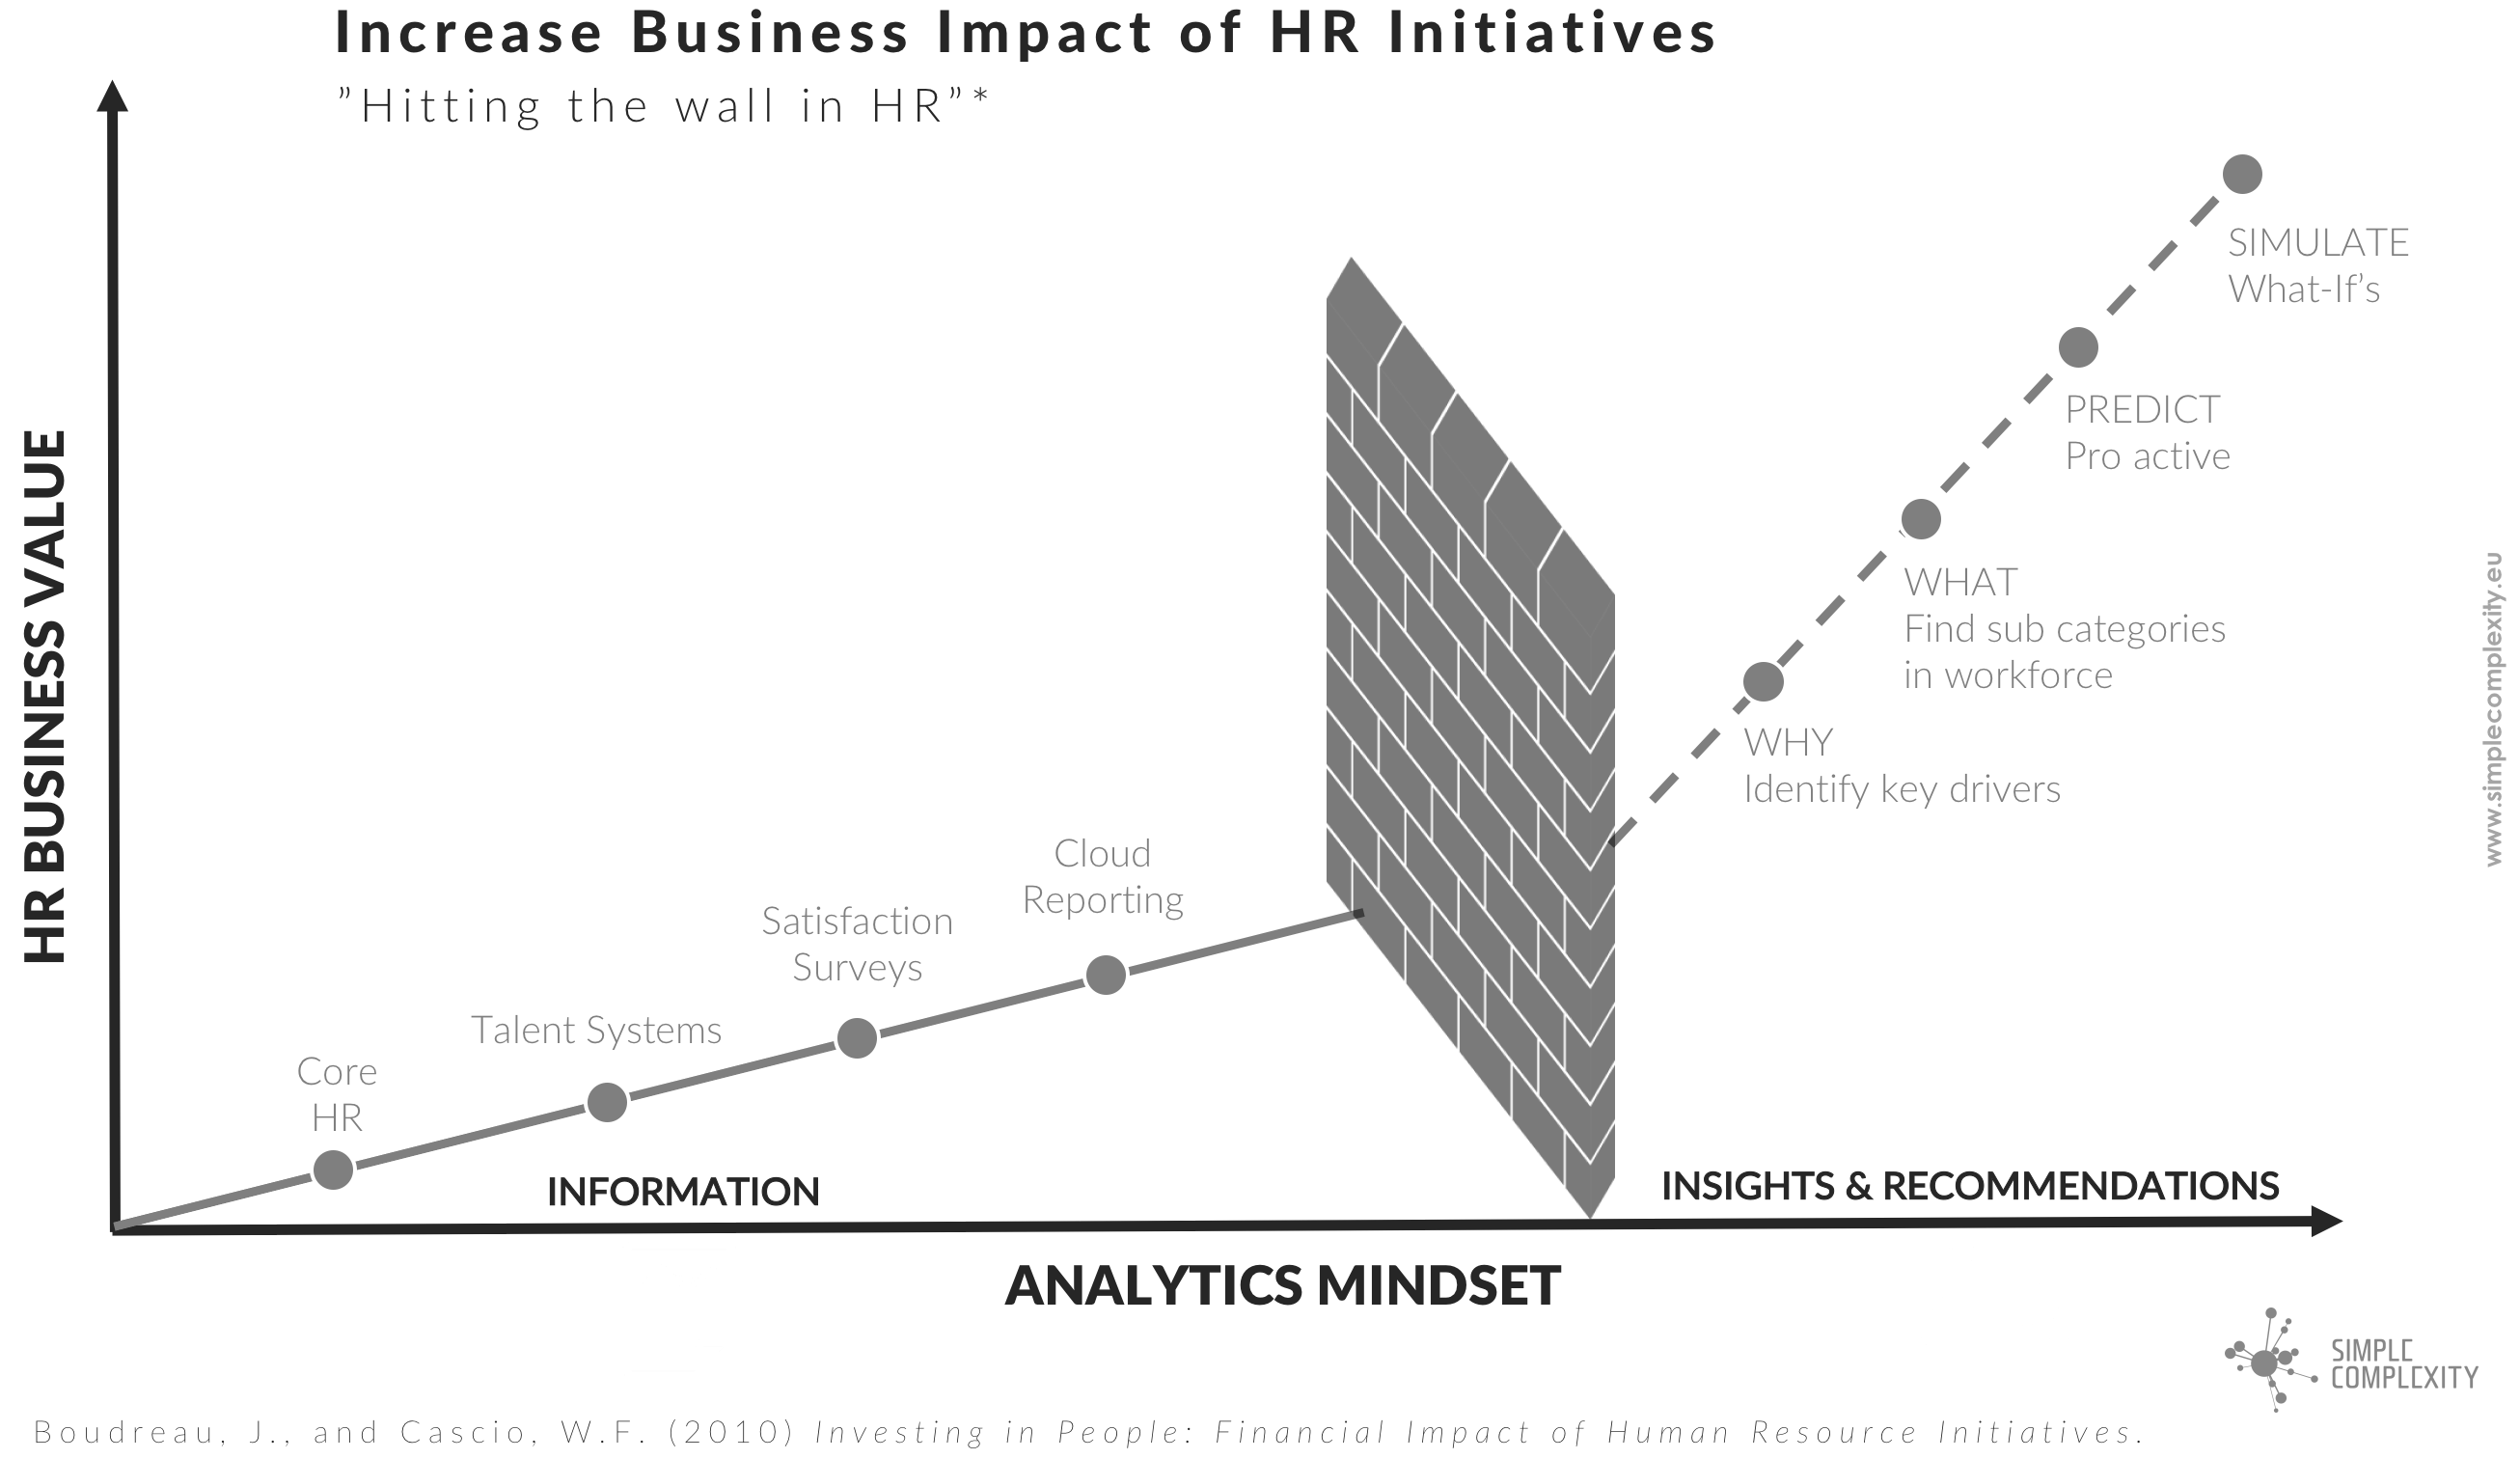
The horizontal axis represents the analytics mindset on how to use data. The more to the right, the higher the analytics mindset. It’s easy to instead call it higher complexity, but some predictive techniques nowadays are so easy, that mindset is a more fundamental obstacle to overwin (hence the wall).
The vertical axis represents an increase in HR business impact. Storing data as such might be very fundamental, but doesn’t have HR business impact. Simulating what-if scenario’s to let the data recommend which HR initiatives would have the desired business impact, do have a high HR business value.
The side before the wall is mainly about structuring data into information on what has happened. Even surveys are often limited to descriptive insights as they are not linked with other HR data on individual level (please stop hiring external survey providers who don’t give you access to data on employee level; you’ll regret later on as it’s time consuming to collect that precious data, and yes there better alternatives!). And cloud reporting solutions often combine different data to get a wider perspective, but still don’t let you understand how HR initiatives impact your business.
So then we arrived and got stuck by that wall. High & massive. You have 2 options to deal with that (aka the blue/red pil in the matrix), but at the end it’s nothing more than a mindset. It doens’t always need to be technically complex, at least not anymore.
Once you’re behind the wall, you enter the theoretically famous analytics maturity world. Why something has happened, what will happen, and what should happen. Here sequentially represented as predictions are better than understanding why things happened, but it perfectly can make more sense to understand something, than to predict that something. Again, short intro only… there are tons of articles on this. However to see real use cases in HR and exchange tips and pitfalls, you’re very welcome at next People Analytics Belgium meetups.
2. The 3 roles of HR
As the first part of this introduction on People Analytics was about the shift from structured information towards evidence based insights & recommendations, the second part was about why HR should take ownership in this, and not e.g. the data governance department.
Therefore we simplified HR into 3 roles, with the Y-Axis again showing the HR Business Impact, and the X-axis representing the size of the organization.
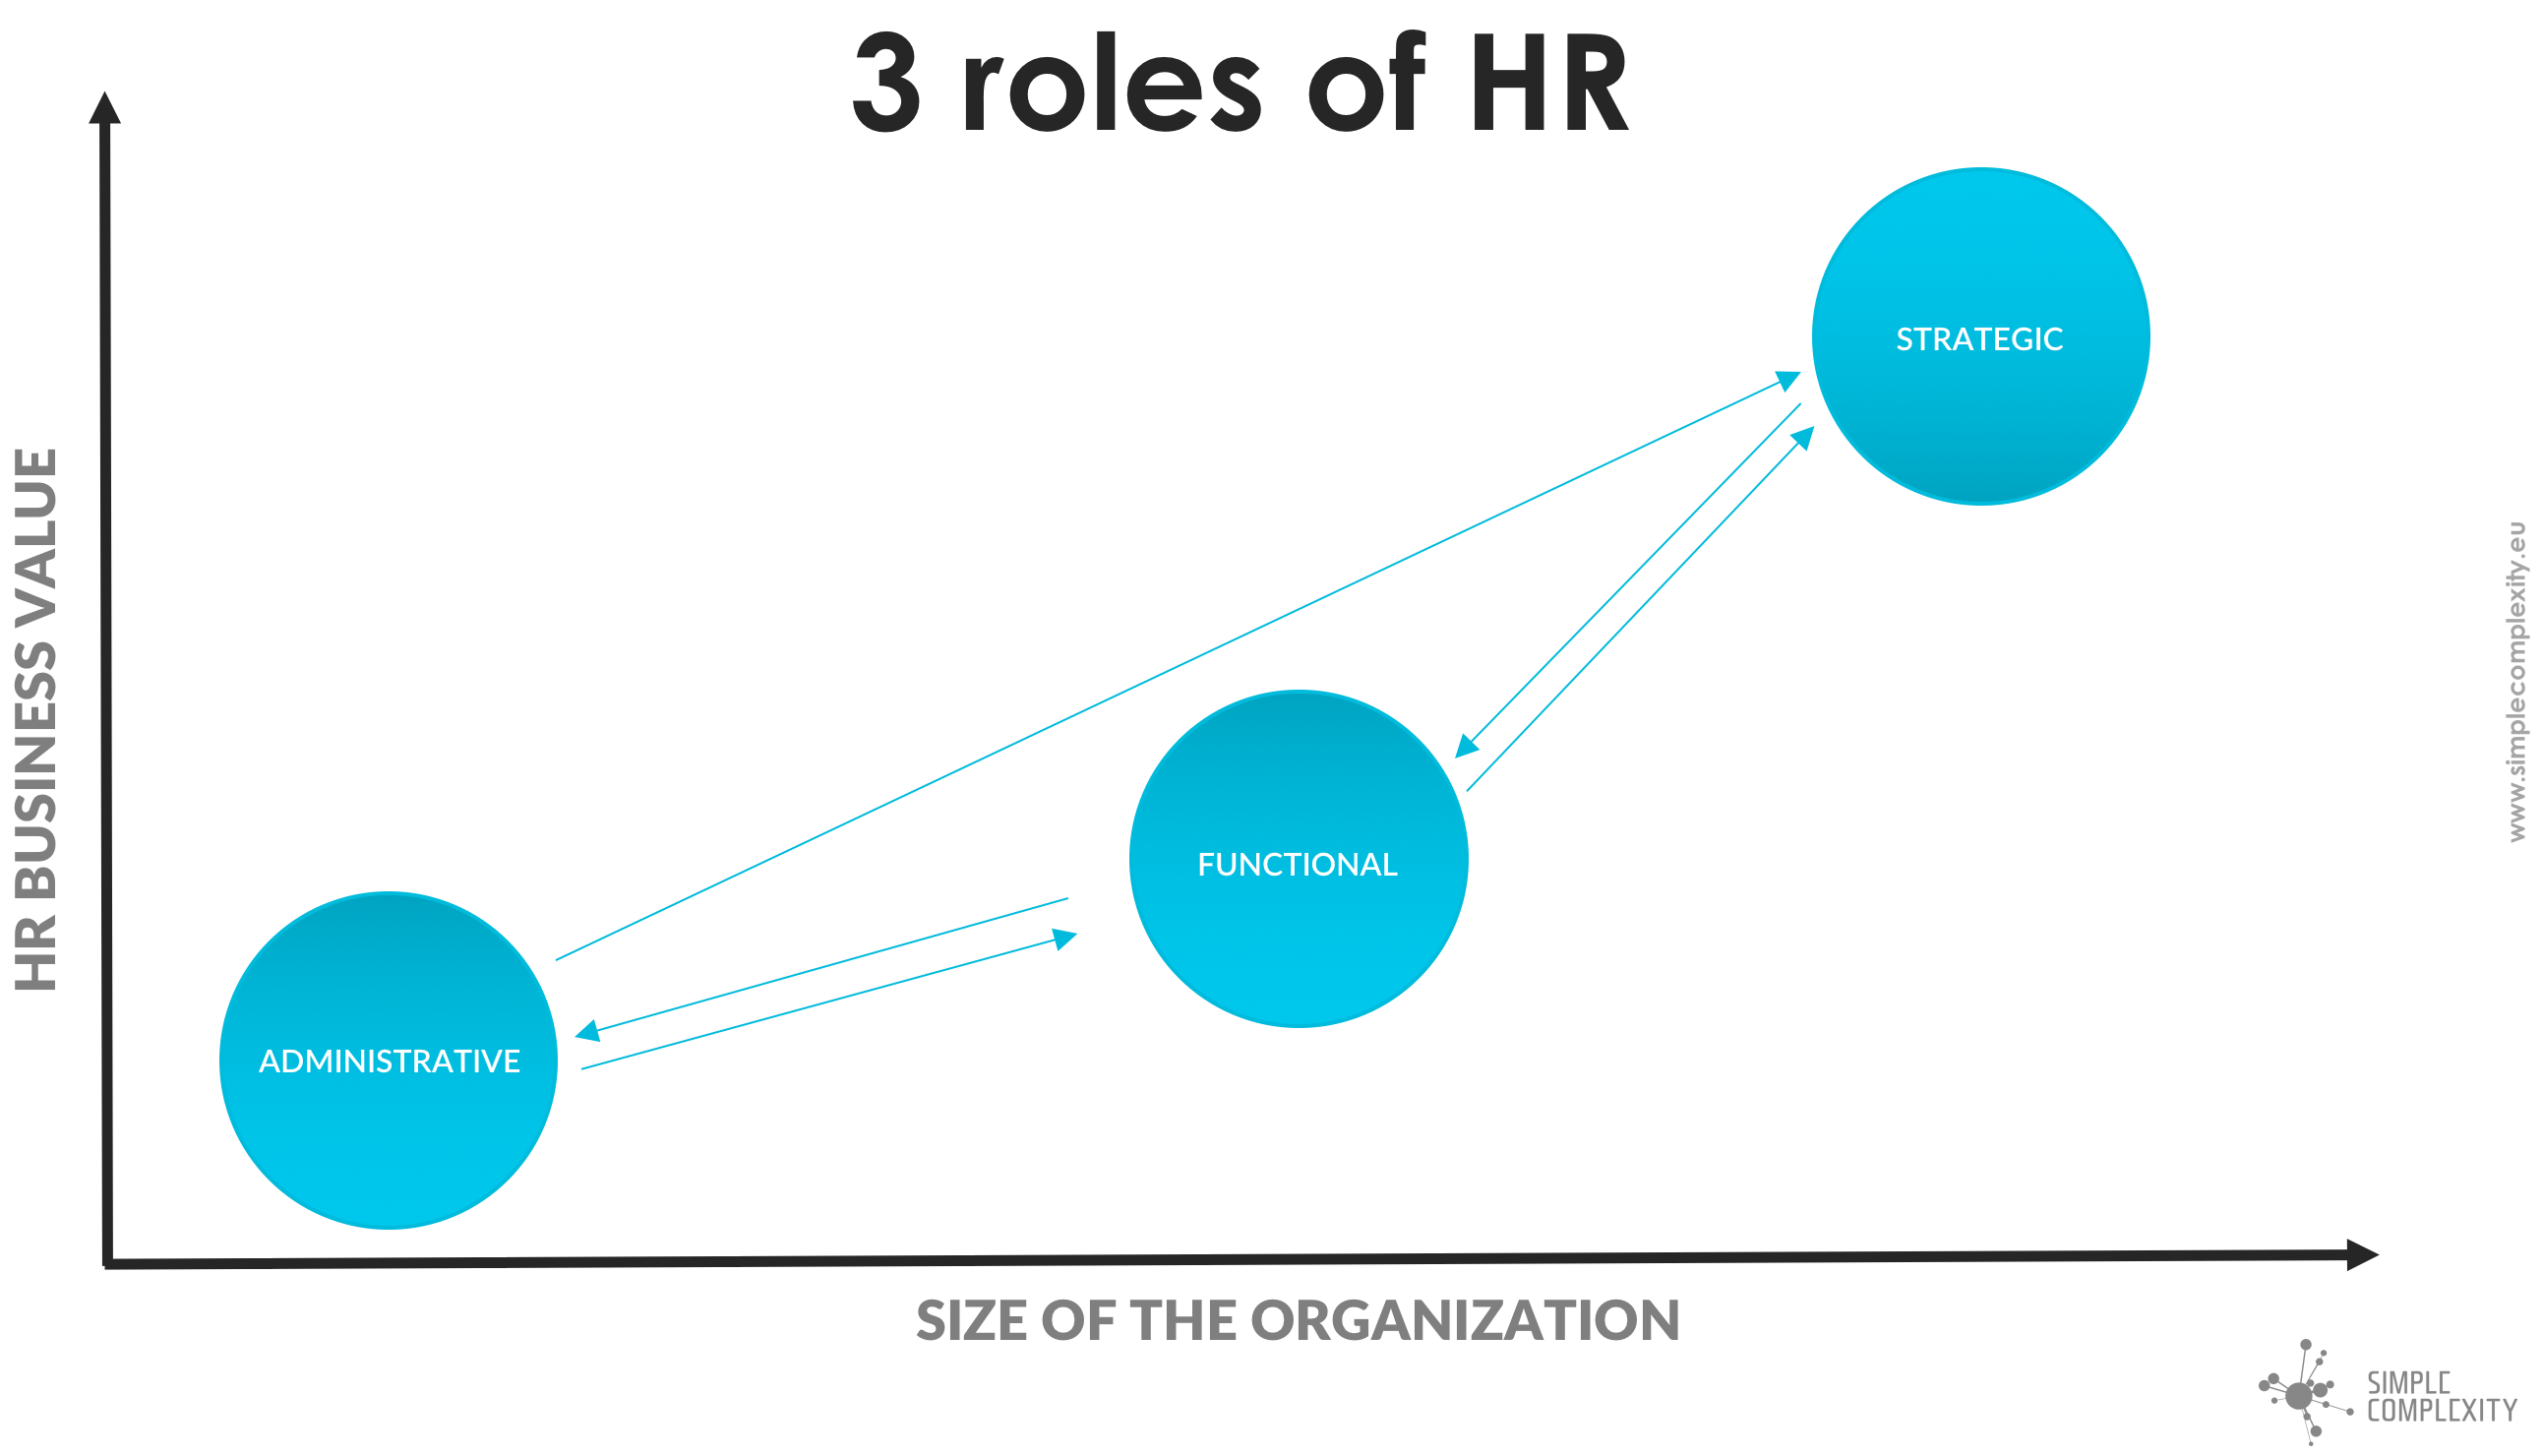
- A first role is the administrative role. In startups this is typically done by the founder himself, as he is responsible to pay his first employees on time.
- A second role is the functional role, which typically starts when the organization roughly exceeds 80 employees, when you cannot know anymore the needs of everyone, and when there’s the money to hire a CHRO. Related to the functional role, we think about people processes such as performance reviews, recruitment process, and so on.
- The third role is the strategic role. This role long has been the difficult one for HR, as it requires to leave the purely HR perspective, and to watch HR initiatives from different angles (check out The Future of HR on youtube, by Dave Ulrich). This role is strongly linked with people analytics. HR watches the market (customers, suppliers, communities, competitors, society, …) to understand the company challenges and its needs to survive, and links all this with the people decisions within the organization. Combine this with the data insights from behind the Wall in HR, and HR now brings true business value to the table.
The thin arrows on the above image represent data and insights shifting from one to the other role. Data is coming from both the administrative role (payroll & time management data) and functional role (data in talent management systems), in order to be used during analyses at the strategic role. The gained strategic findings can be used directly as input for strategic company decisions. Or they can also be implemented into the functional role, to tailor people processes in talent management (and operational) systems. HR not only knows which data could be extracted (or new data creations) from these systems, but also could make the reverse direction in order to increase the impact of functional HR.
This is in a nutshell my intro from yesterday at the People Analytics Belgium kick-off. I’d love to hear your questions or remarks, so don’t hesitate to post them in the comment section below, or at our ‘People Analytics Belgium’ Facebook page (it’s a closed group, so no share with your family). If you’re busy with analytics in HR, and want to ask something on topics, methods, tools, whatever, … Facebook page.
Alternatively, don’t hesitate to get in touch with me off-social for questions related to people analytics: sam@simplecomplexity.eu.
Enjoy your day, evening or weekend!
Sam
This post was originally posted on LinkedIn on April, 21 2017 by Sam Rédelé. Sam founded Simple Complexity in 2011, specialised in people analytics. Sam cofounded the Belgian data science community in 2014, and founded People Analytics Belgium in 2017. Both communities are non profit oriented, aiming to share knowledge via meetups, trainings and hackathons. You can reach him via sam@simplecomplexity.eu, connect with him on LinkedIn or follow him on Twitter via @samredele.